
|
1) Complete your Canva assignment, then download it as a png file, then upload it to freshgrade portfolio with the code from your teacher. 2) Visit Keybr and create an account using your email. Complete 10-12 minutes of practice. From now on we will start most classes this way. 3) After your typing practice go to the profile button on the side bar  Go under Desk tools and open Excel. Create a table where you can track your Top Speed and Average Speed.
Record your values from today and then save the file as "Typing Progress" 4.) Visit this shared document. Google Docs allows you to change sharing settings so that people can view, edit or just comment on a document. Viewing is good when you only want someone to see what you wrote Edit is for when you want someone to change what you wrote. Commenting is good for peer editing and lets someone else make suggestions on your work In the table create your own row, and add your first name. Then visit Google Forms Read these instructions then Explore around and try creating a survey for your classmates to complete. You can ask their opinion, get them to choose their favourites, etc. Your survey must include 5 Questions and at least three different types of questions. For full marks surveys should include some photos (make sure they are high quality) Once you have made your survey, paste the shareable link into the shared document where you put your name. As students put up their links, complete their survey! 1) Get computer login and view Course Syllabus
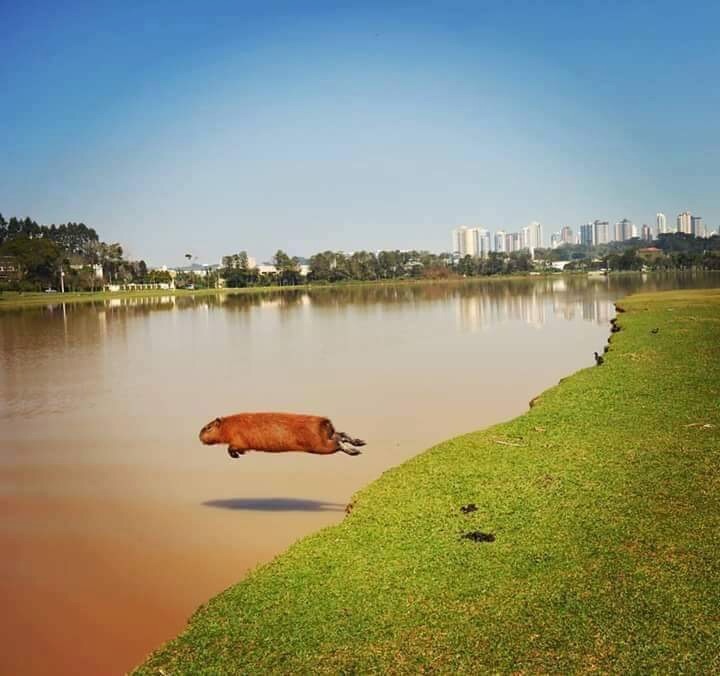
2) Complete Digital Literacy Survey 3) Submit a question that you want answered about me 4) Go to Canva and create an account - Under Documents, choose US Letter and create a poster about yourself -Include your first name, 4 pictures of your interests, a quote (something said by a person real or fictional that inspires you) and then include two facts about you. -Use colours, high quality pictures - When you are done then download it as a png file and upload it to your Freshgrade Portfolio You need to finish all projects and Digital Citizenship up to the end of Unit 3. New options begin next week.  If you have time and want to do another Photoshop Battle, use the image above and post it here
Using your typing data and the information found in this video, you need to create a digital graph in excel. This task can also be accomplished in Google Docs.
Your graph should include the following
when you are finished, you need to show your graph to Mr. Rockwell Please complete the following two surveys today before continuing digital citizenship.
Survey One Survey Two |
Block 2 and 6Archives
June 2017
Categories |

 RSS Feed
